FXで自動取引するプログラムを作ってみようと思い立ち、MT4のMetaEditorでチャートにグラフを作成する「カスタムインディケータ」を作成する手順を備忘録的に投稿します。
MetaEditorでインディケータ作成
プログラムされた内容で外貨取引(FX)の自動売買を実行するためのプラットフォームとして今回は、MT4を使います。
カスタムインディケータを作成する手順については、別記事をご覧ください。
[カスタムインディケータ]の修整
今回は、MetaTraderのチャート画面に終値のグラフを追加する[カスタムインディケータ]を作成してみます。
最初から作るのが面倒なので、先回[エキスポート]画面に “Hello World.” を表示する[カスタムインディケータ]を修整していきます。
具体的には次のような操作で行います。
1. [MetaEditor]を開きます。
2.[ナビゲータ]画面で[MQL4|Indicators|HelloWorld.mq4]を開きます。
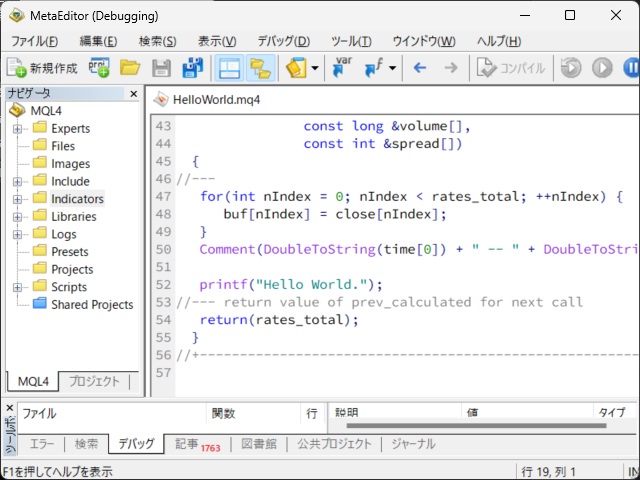
3. 表示されたコードを、修整します。(太字の部分)
//+------------------------------------------------------------------+
//|                                                   HelloWorld.mq4 |
//|                                  Copyright 2024, MetaQuotes Ltd. |
//|                                             https://www.mql5.com |
//+------------------------------------------------------------------+
#property copyright "Copyright 2024, MetaQuotes Ltd."
#property link      "https://www.mql5.com"
#property version   "1.00"
#property strict
#property indicator_chart_window

#property indicator_buffers 10
#property indicator_plots 10
#property indicator_label1 "HelloLine 1"
#property indicator_type1 DRAW_LINE
#property indicator_color1 clrYellow
#property indicator_style1 STYLE_SOLID
#property indicator_width1 10

double closebuf[];

//+------------------------------------------------------------------+
//| Custom indicator initialization function                         |
//+------------------------------------------------------------------+
int OnInit()
  {
//--- indicator buffers mapping
   SetIndexBuffer(0, closebuf, INDICATOR_DATA);

//---
   return(INIT_SUCCEEDED);
  }
//+------------------------------------------------------------------+
//| Custom indicator iteration function                              |
//+------------------------------------------------------------------+
int OnCalculate(const int rates_total,
                const int prev_calculated,
                const datetime &time[],
                const double &open[],
                const double &high[],
                const double &low[],
                const double &close[],
                const long &tick_volume[],
                const long &volume[],
                const int &spread[])
  {
//---
   for(int nIndex = 0; nIndex < rates_total; ++nIndex) {
      closebuf[nIndex] = close[nIndex];
   }

   Comment(TimeToString(time[0], TIME_SECONDS) + " -- " + DoubleToString(close[0]));

   printf("Hello World.");
//--- return value of prev_calculated for next call
   return(rates_total);
  }
//+------------------------------------------------------------------+
カスタムインディケータを実行
作成した[カスタムインディケータ]を実行してみます。
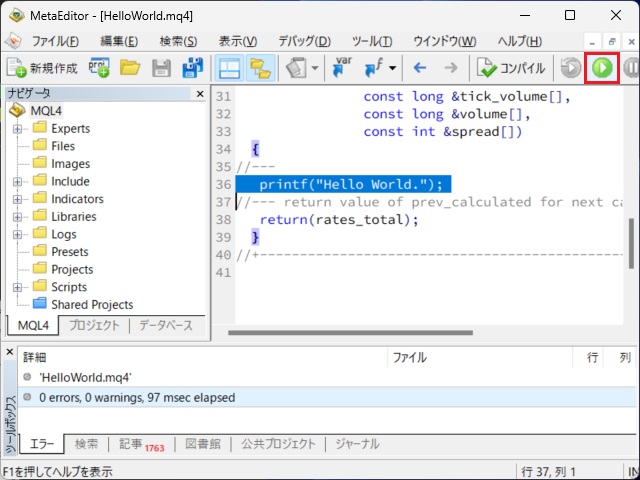
1. [MetaEditor]で[カスタムインディケータ]を表示した状態で[実行]アイコンをクリックします。
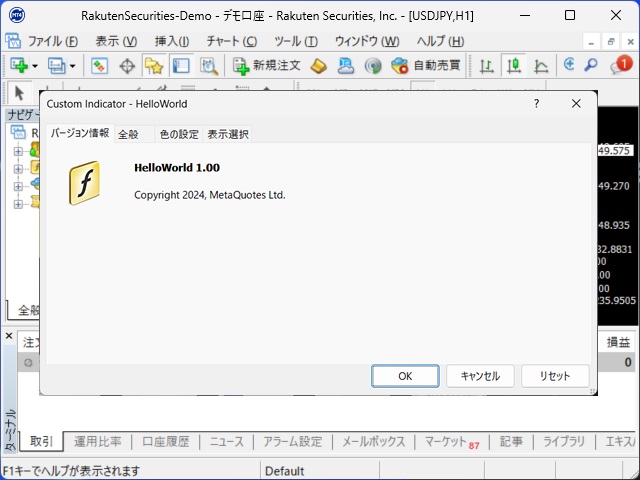
2.[MT]で表示された[カスタムインディケータ]の実行画面で[OK]をクリックします。
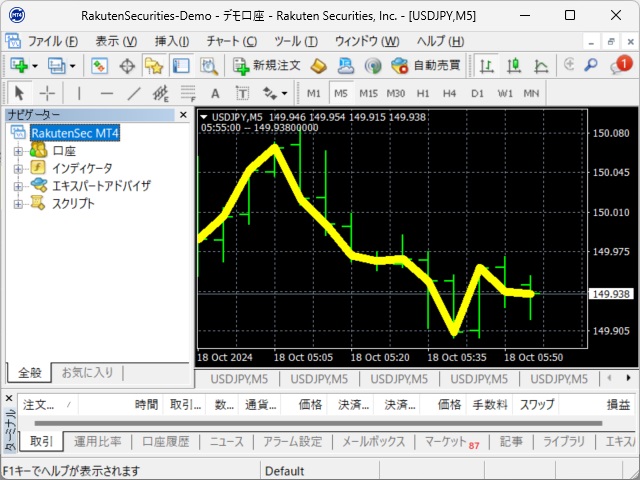
3.[チャート]画面の左上に最新の終値が表示され、終値を結んだ黄色の折れ線グラフが追加されます。
4.[MetaEditor]画面の[停止]をクリックすると[カスタムインディケータ]の実行が中断されます。

まとめ
今回は、外貨取引(FX)で利用できる自動売買プラットフォームの[MT4]のチャートにグラフを追加するカスタムインディケータを作成する手順を紹介しました。
MT4の画面で、取引に関する表示をカスタマイズする[カスタムインディケータ]の[OnCalculate]イベントを編集することでグラフやテキストをチャート画面に追加することが可能です。
[MT4]のチャート画面にテキストやグラフを描画したい人の参考になれば幸いです。
スポンサーリンク
最後までご覧いただき、ありがとうございます。